容器监控
说到容器监控我们自然会想到 cAdvisor,我们前面也说过 cAdvisor 已经内置在了 kubelet 组件之中,所以我们不需要单独去安装,cAdvisor 的数据路径为 /api/v1/nodes/<node>/proxy/metrics,但是我们不推荐使用这种方式,因为这种方式是通过 APIServer 去代理访问的,对于大规模的集群会对 APIServer 造成很大的压力,所以我们可以直接通过访问 kubelet 的 /metrics/cadvisor 这个端点来获取 cAdvisor 的数据。
cAdvisor
我们这里使用 node 的服务发现模式,因为每一个节点下面都有 kubelet,自然都有 cAdvisor 采集到的数据指标,配置如下:
- job_name: 'cadvisor'
  kubernetes_sd_configs:
    - role: node
  scheme: https
  tls_config:
    ca_file: /var/run/secrets/kubernetes.io/serviceaccount/ca.crt
    insecure_skip_verify: true
  bearer_token_file: /var/run/secrets/kubernetes.io/serviceaccount/token
  relabel_configs:
    - action: labelmap
      regex: __meta_kubernetes_node_label_(.+)
      replacement: $1
    - replacement: /metrics/cadvisor # <nodeip>/metrics -> <nodeip>/metrics/cadvisor
      target_label: __metrics_path__
  # 下面的方式不推荐使用
  # - target_label: __address__
  #   replacement: kubernetes.default.svc:443
  # - target_label: __metrics_path__
  #   replacement: /api/v1/nodes/${1}/proxy/metrics/cadvisor
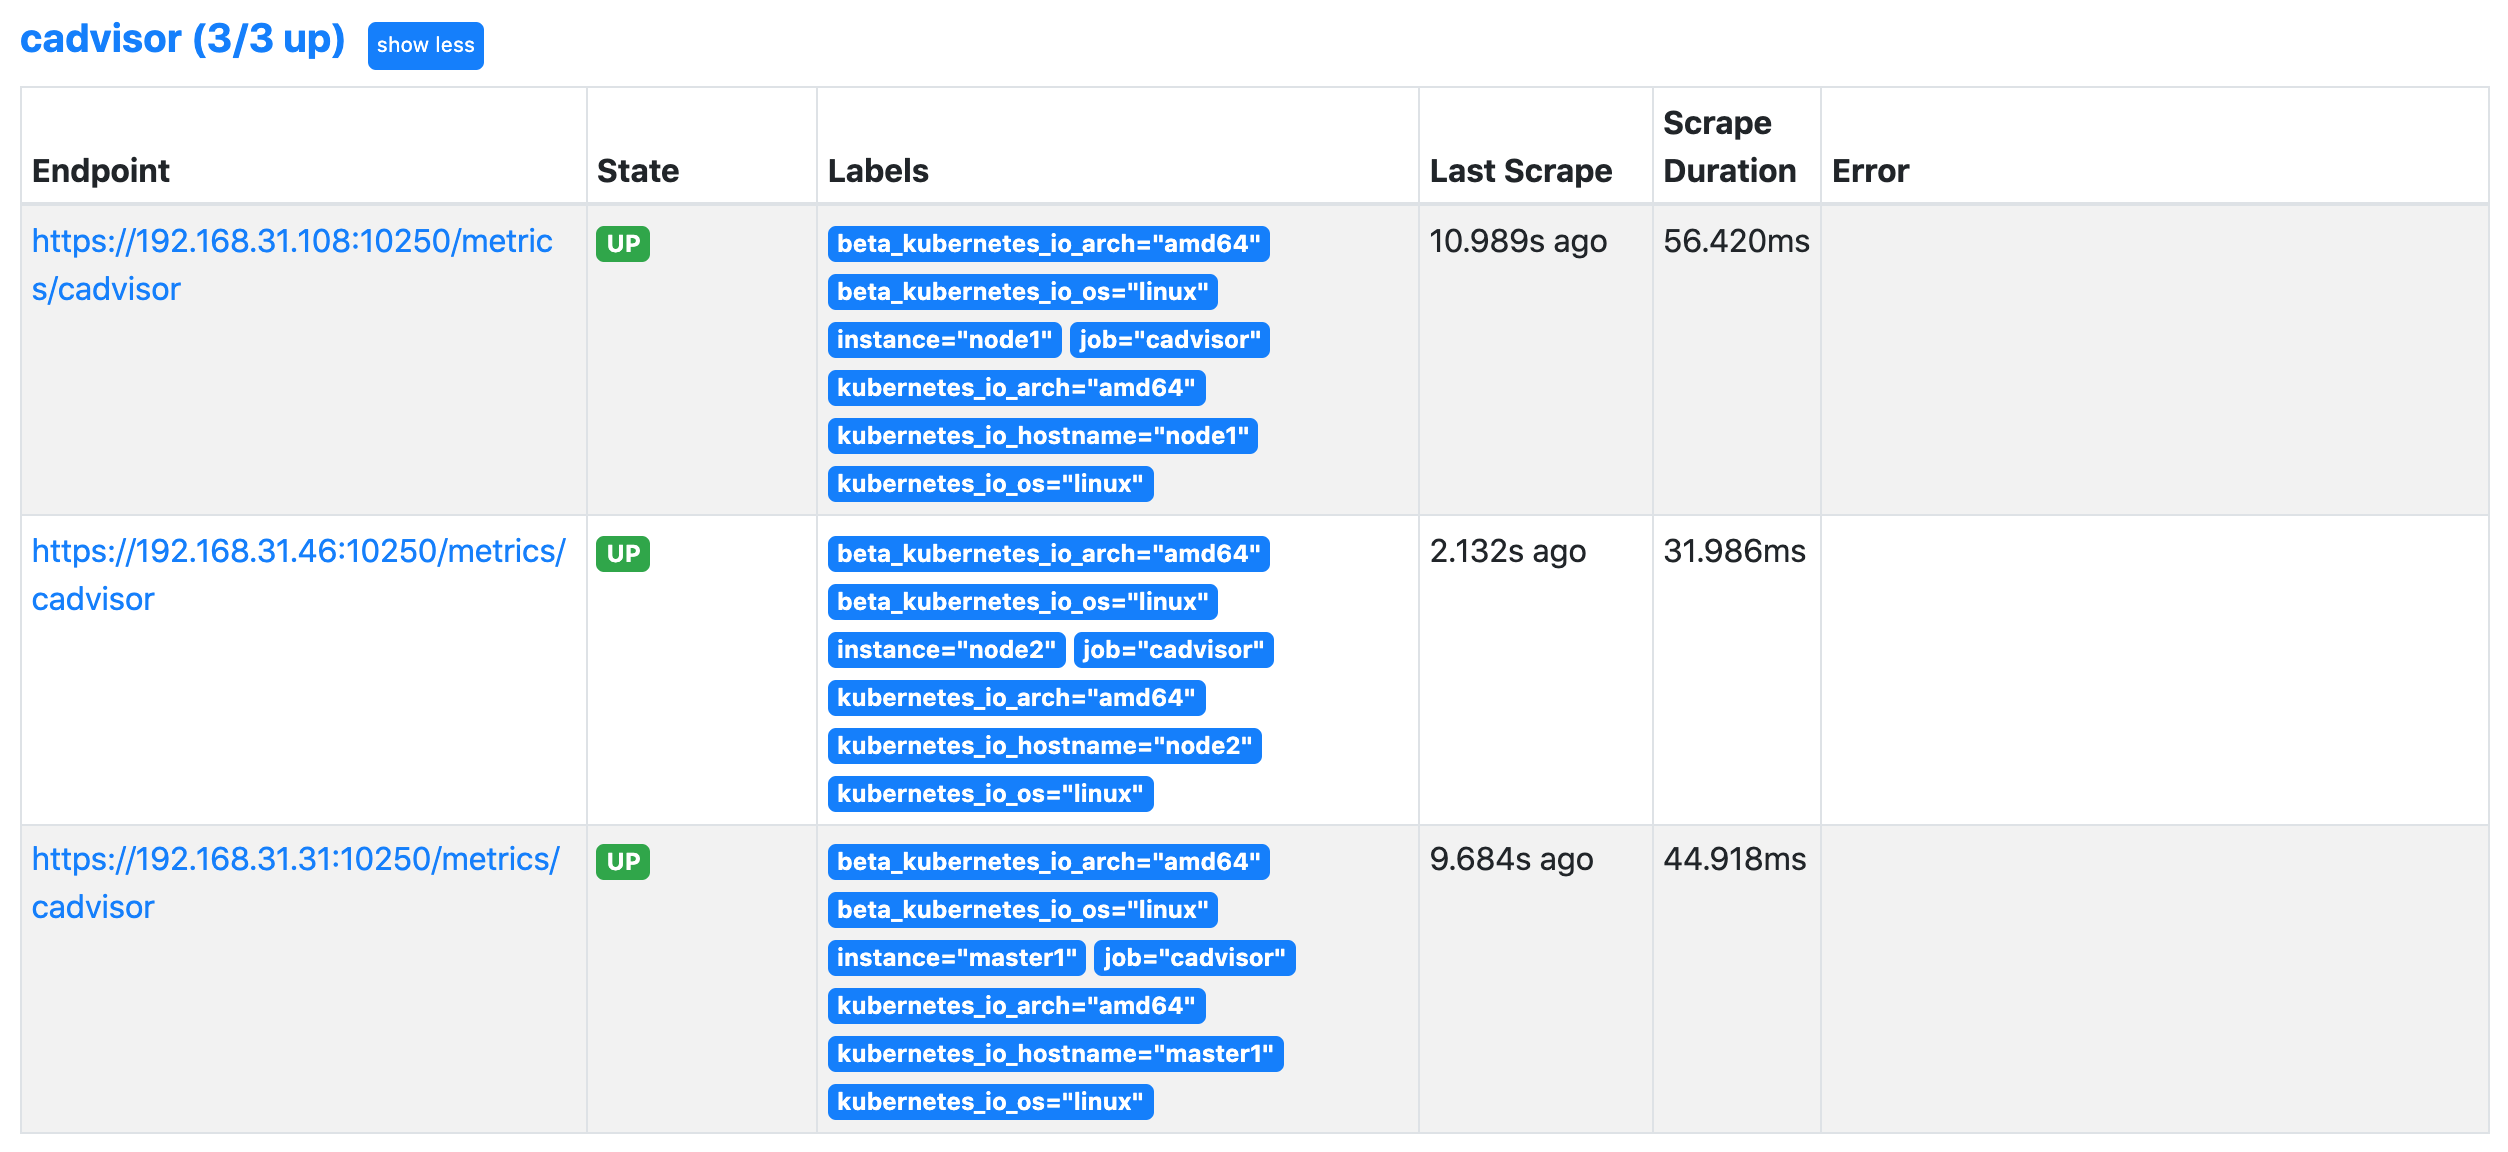
上面的配置和我们之前配置 node-exporter 的时候几乎是一样的,区别是我们这里使用了 https 的协议,另外需要注意的是配置了 ca.cart 和 token 这两个文件,这两个文件是 Prometheus 的 Pod 启动后自动注入进来的,然后加上 __metrics_path__ 的访问路径 /metrics/cadvisor,现在同样更新下配置,然后查看 Targets 路径:
指标查询
我们可以切换到 Graph 路径下面查询容器相关数据,比如我们这里来查询集群中所有 Pod 的 CPU 使用情况,kubelet 中的 cAdvisor 采集的指标和含义,可以查看 Monitoring cAdvisor with Prometheus 说明,比如其中有一项:
container_cpu_usage_seconds_total Counter Cumulative cpu time consumed seconds
container_cpu_usage_seconds_total 是容器累计使用的 CPU 时间,用它除以 CPU 的总时间,就可以得到容器的 CPU 使用率了。
首先计算容器的 CPU 占用时间,由于节点上的 CPU 有多个,所以需要将容器在每个 CPU 上占用的时间累加起来,Pod 在 1m 内累积使用的 CPU 时间为:(根据 pod 和 namespace 进行分组查询)
sum(rate(container_cpu_usage_seconds_total{image!="",pod!=""}[1m])) by (namespace, pod)
然后计算 CPU 的总时间,这里的 CPU 数量是容器分配到的 CPU 数量,container_spec_cpu_quota 这个指标就是容器的 CPU 配额,它的值是容器指定的 CPU 个数 * 100000,所以 Pod 在 1s 内 CPU 的总时间为:Pod 的 CPU 核数 * 1s:
sum(container_spec_cpu_quota{image!="", pod!=""}) by(namespace, pod) / 100000
由于
container_spec_cpu_quota是容器的 CPU 配额,所以只有配置了resource-limitCPU 的 Pod 才可以获得该指标数据。
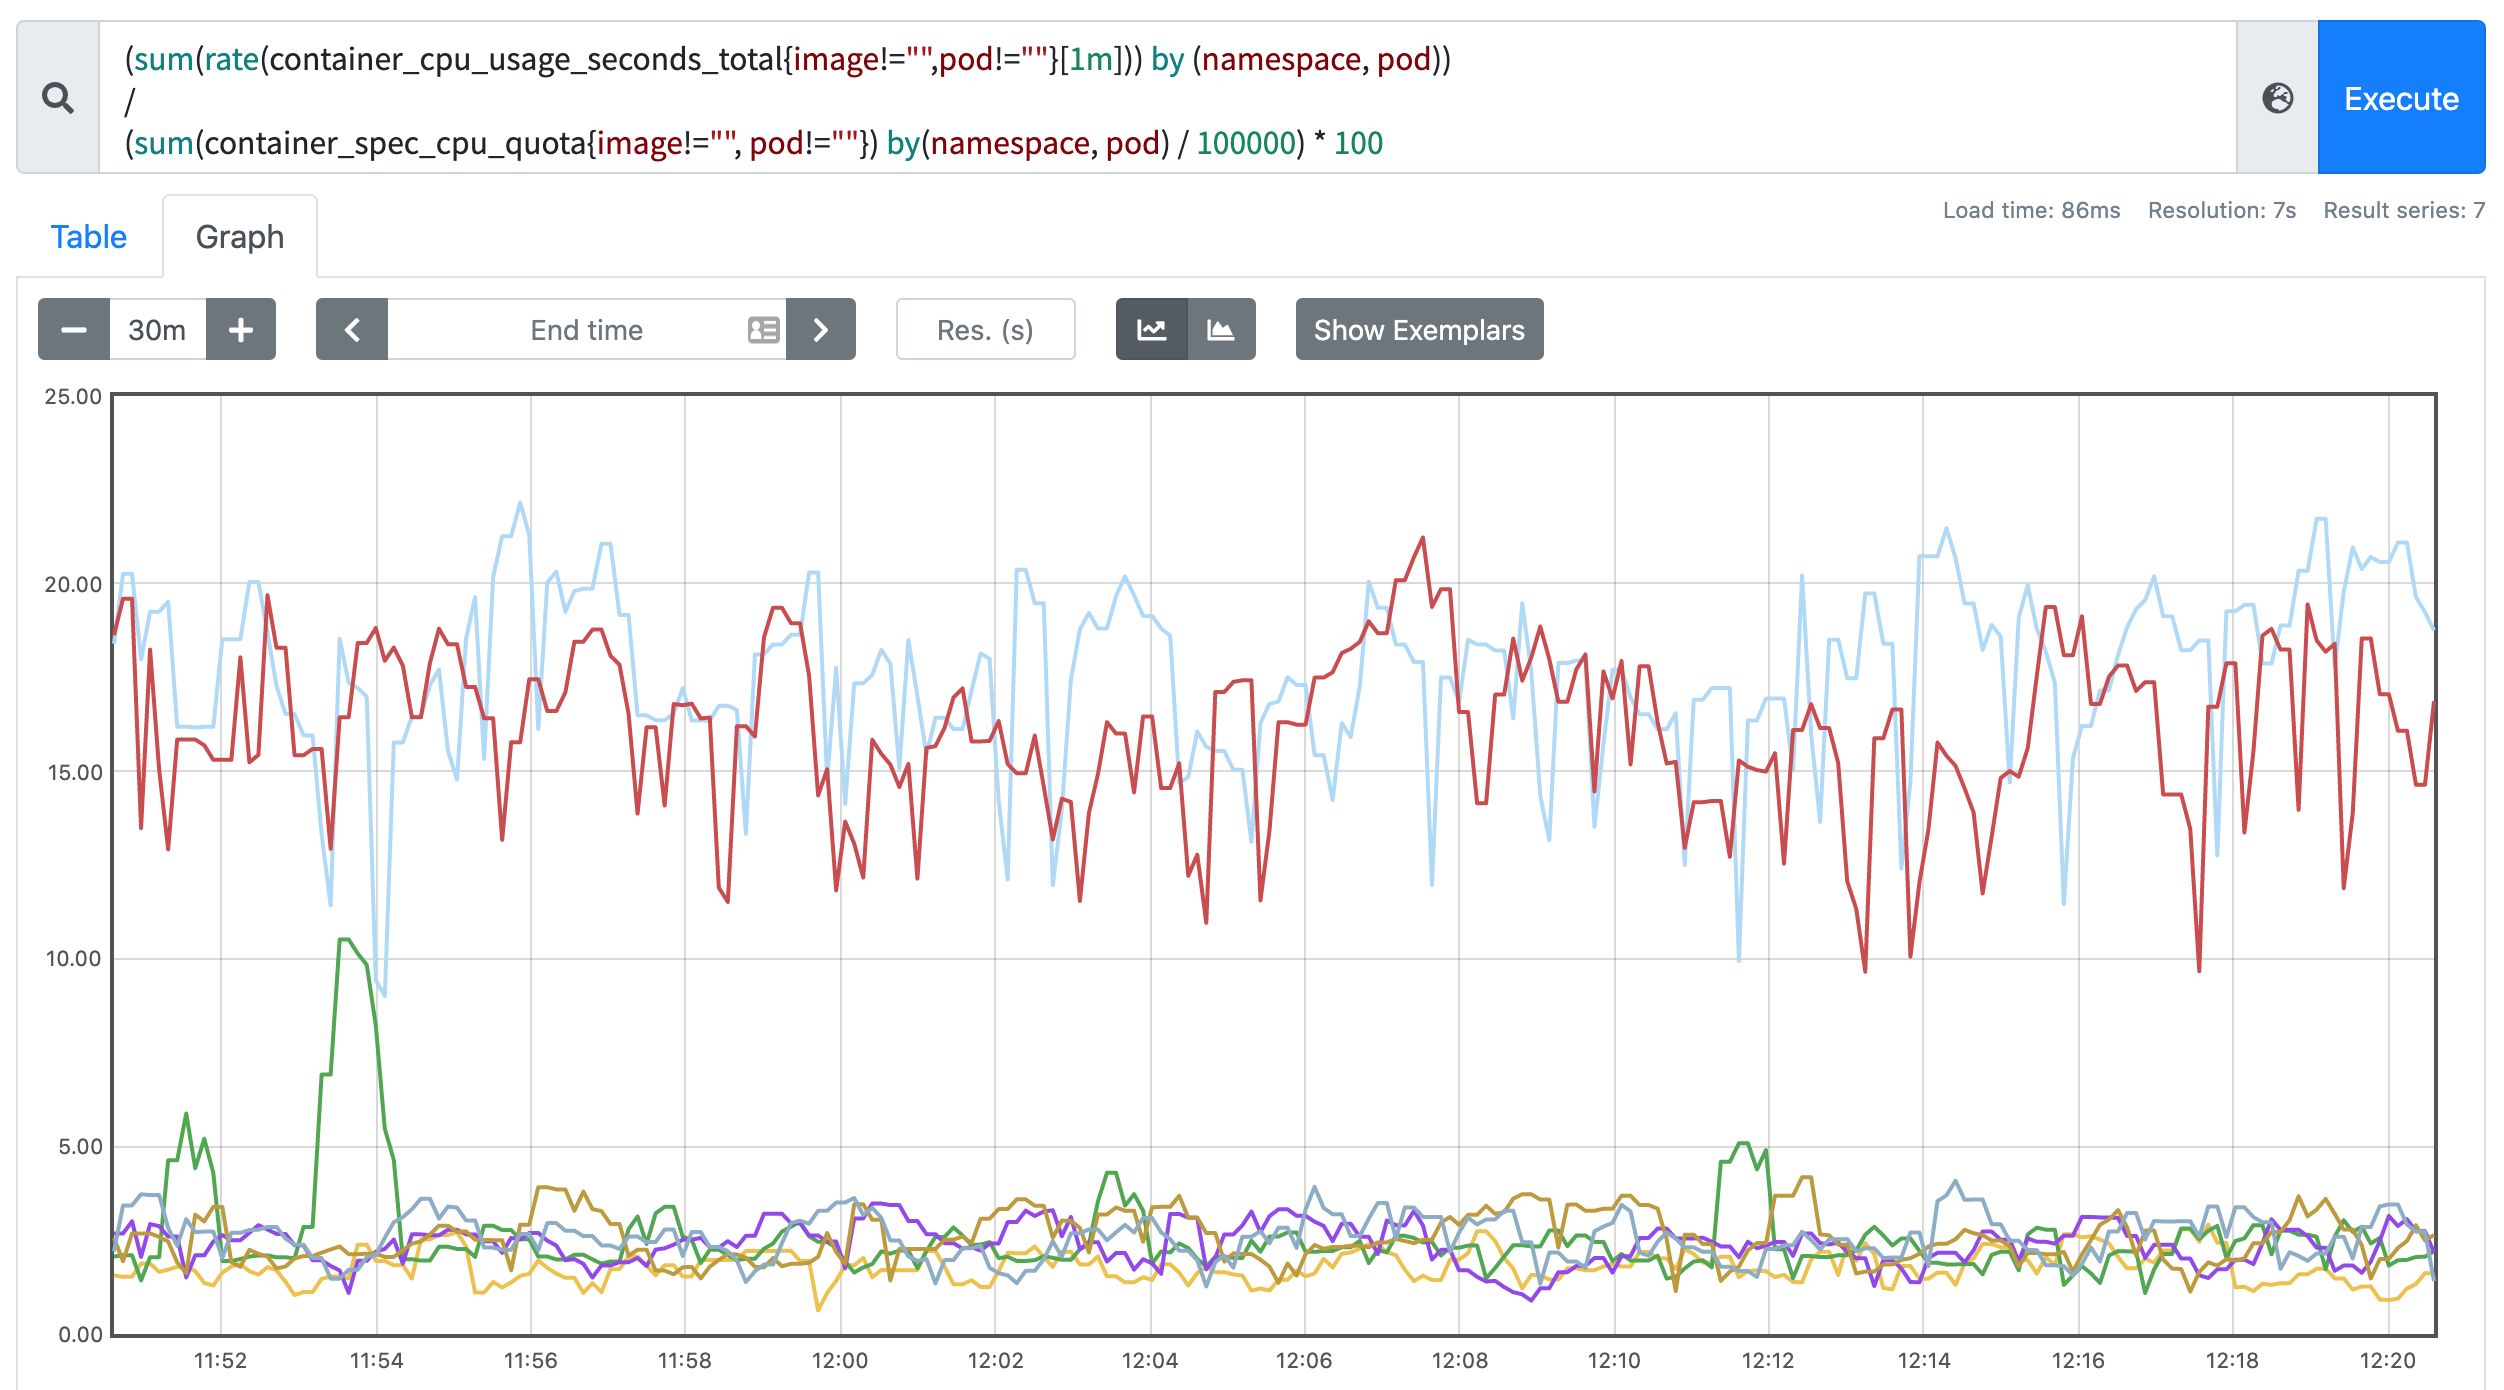
将上面这两个语句的结果相除,就得到了容器的 CPU 使用率:
(sum(rate(container_cpu_usage_seconds_total{image!="",pod!=""}[1m])) by (namespace, pod))
/
(sum(container_spec_cpu_quota{image!="", pod!=""}) by(namespace, pod) / 100000) * 100
在 promethues 里面执行上面的 promQL 语句可以得到下面的结果:
Pod 内存使用率的计算就简单多了,不过我们也要想了解几个和 Pod 内存使用率相关的指标:
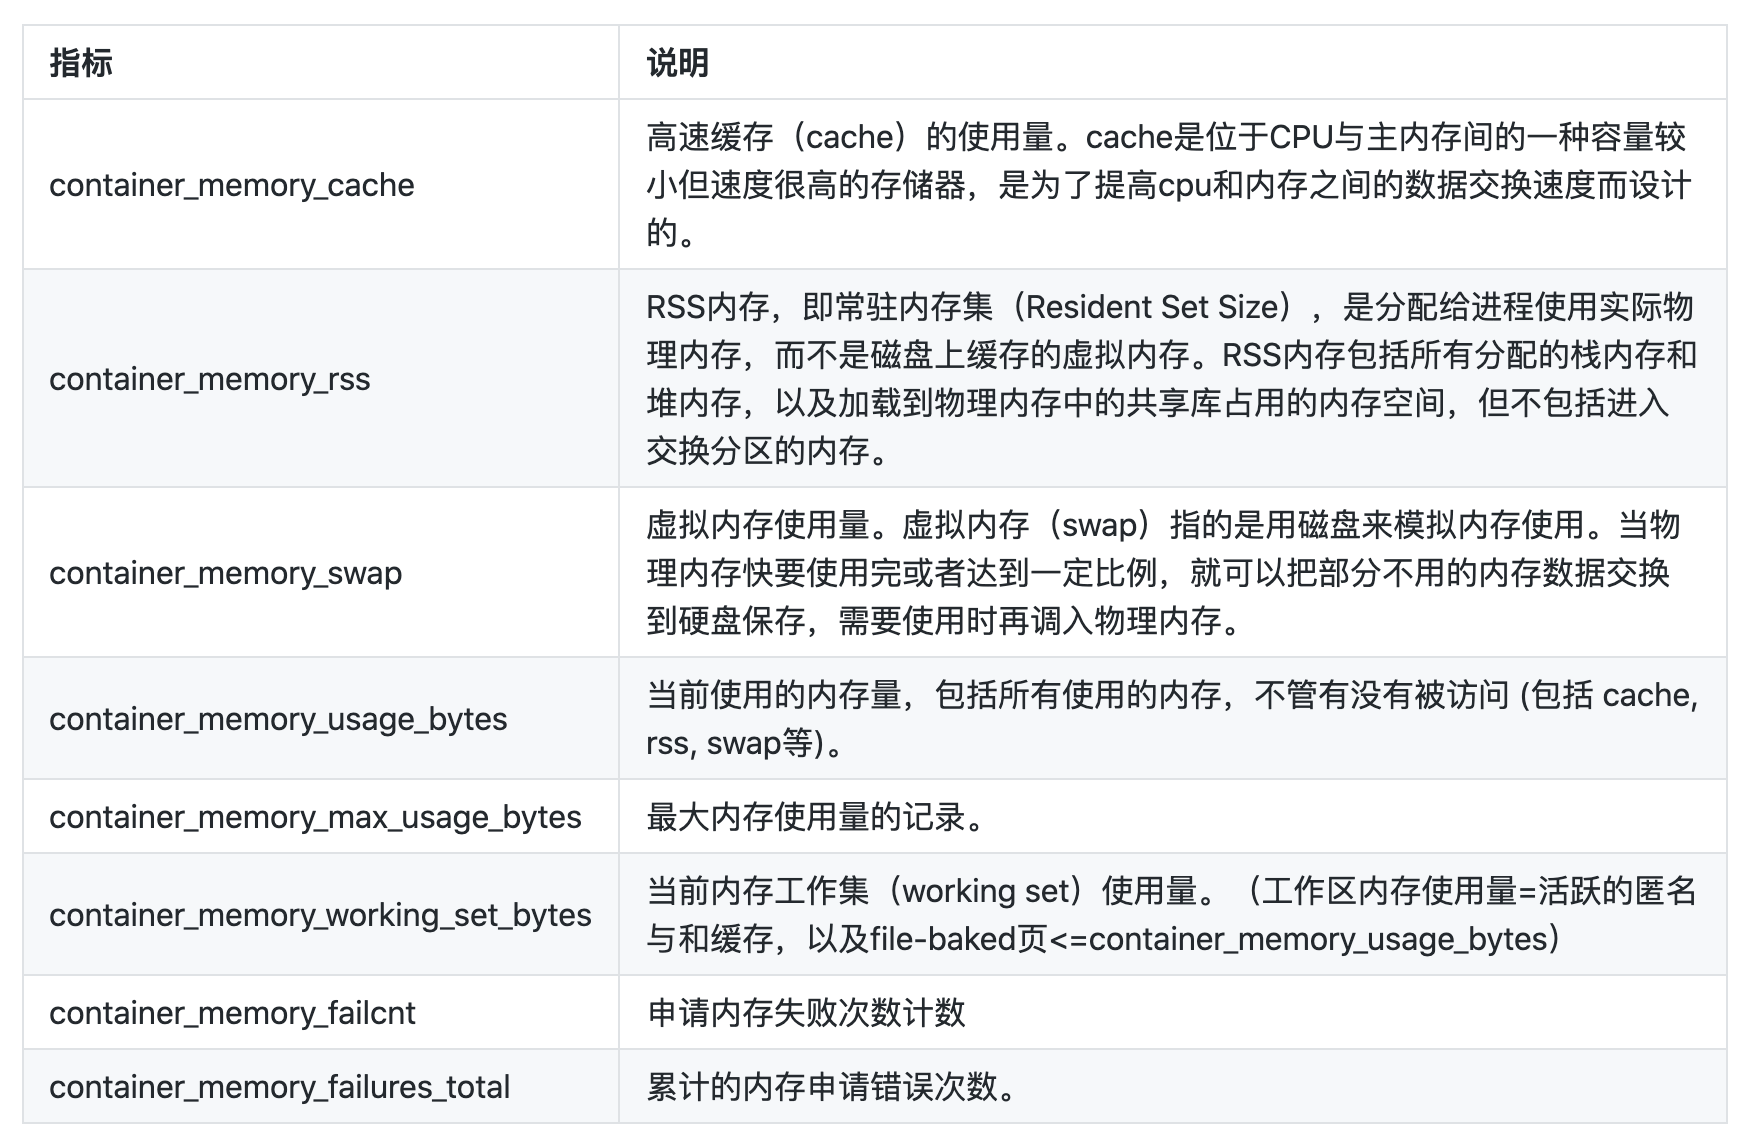
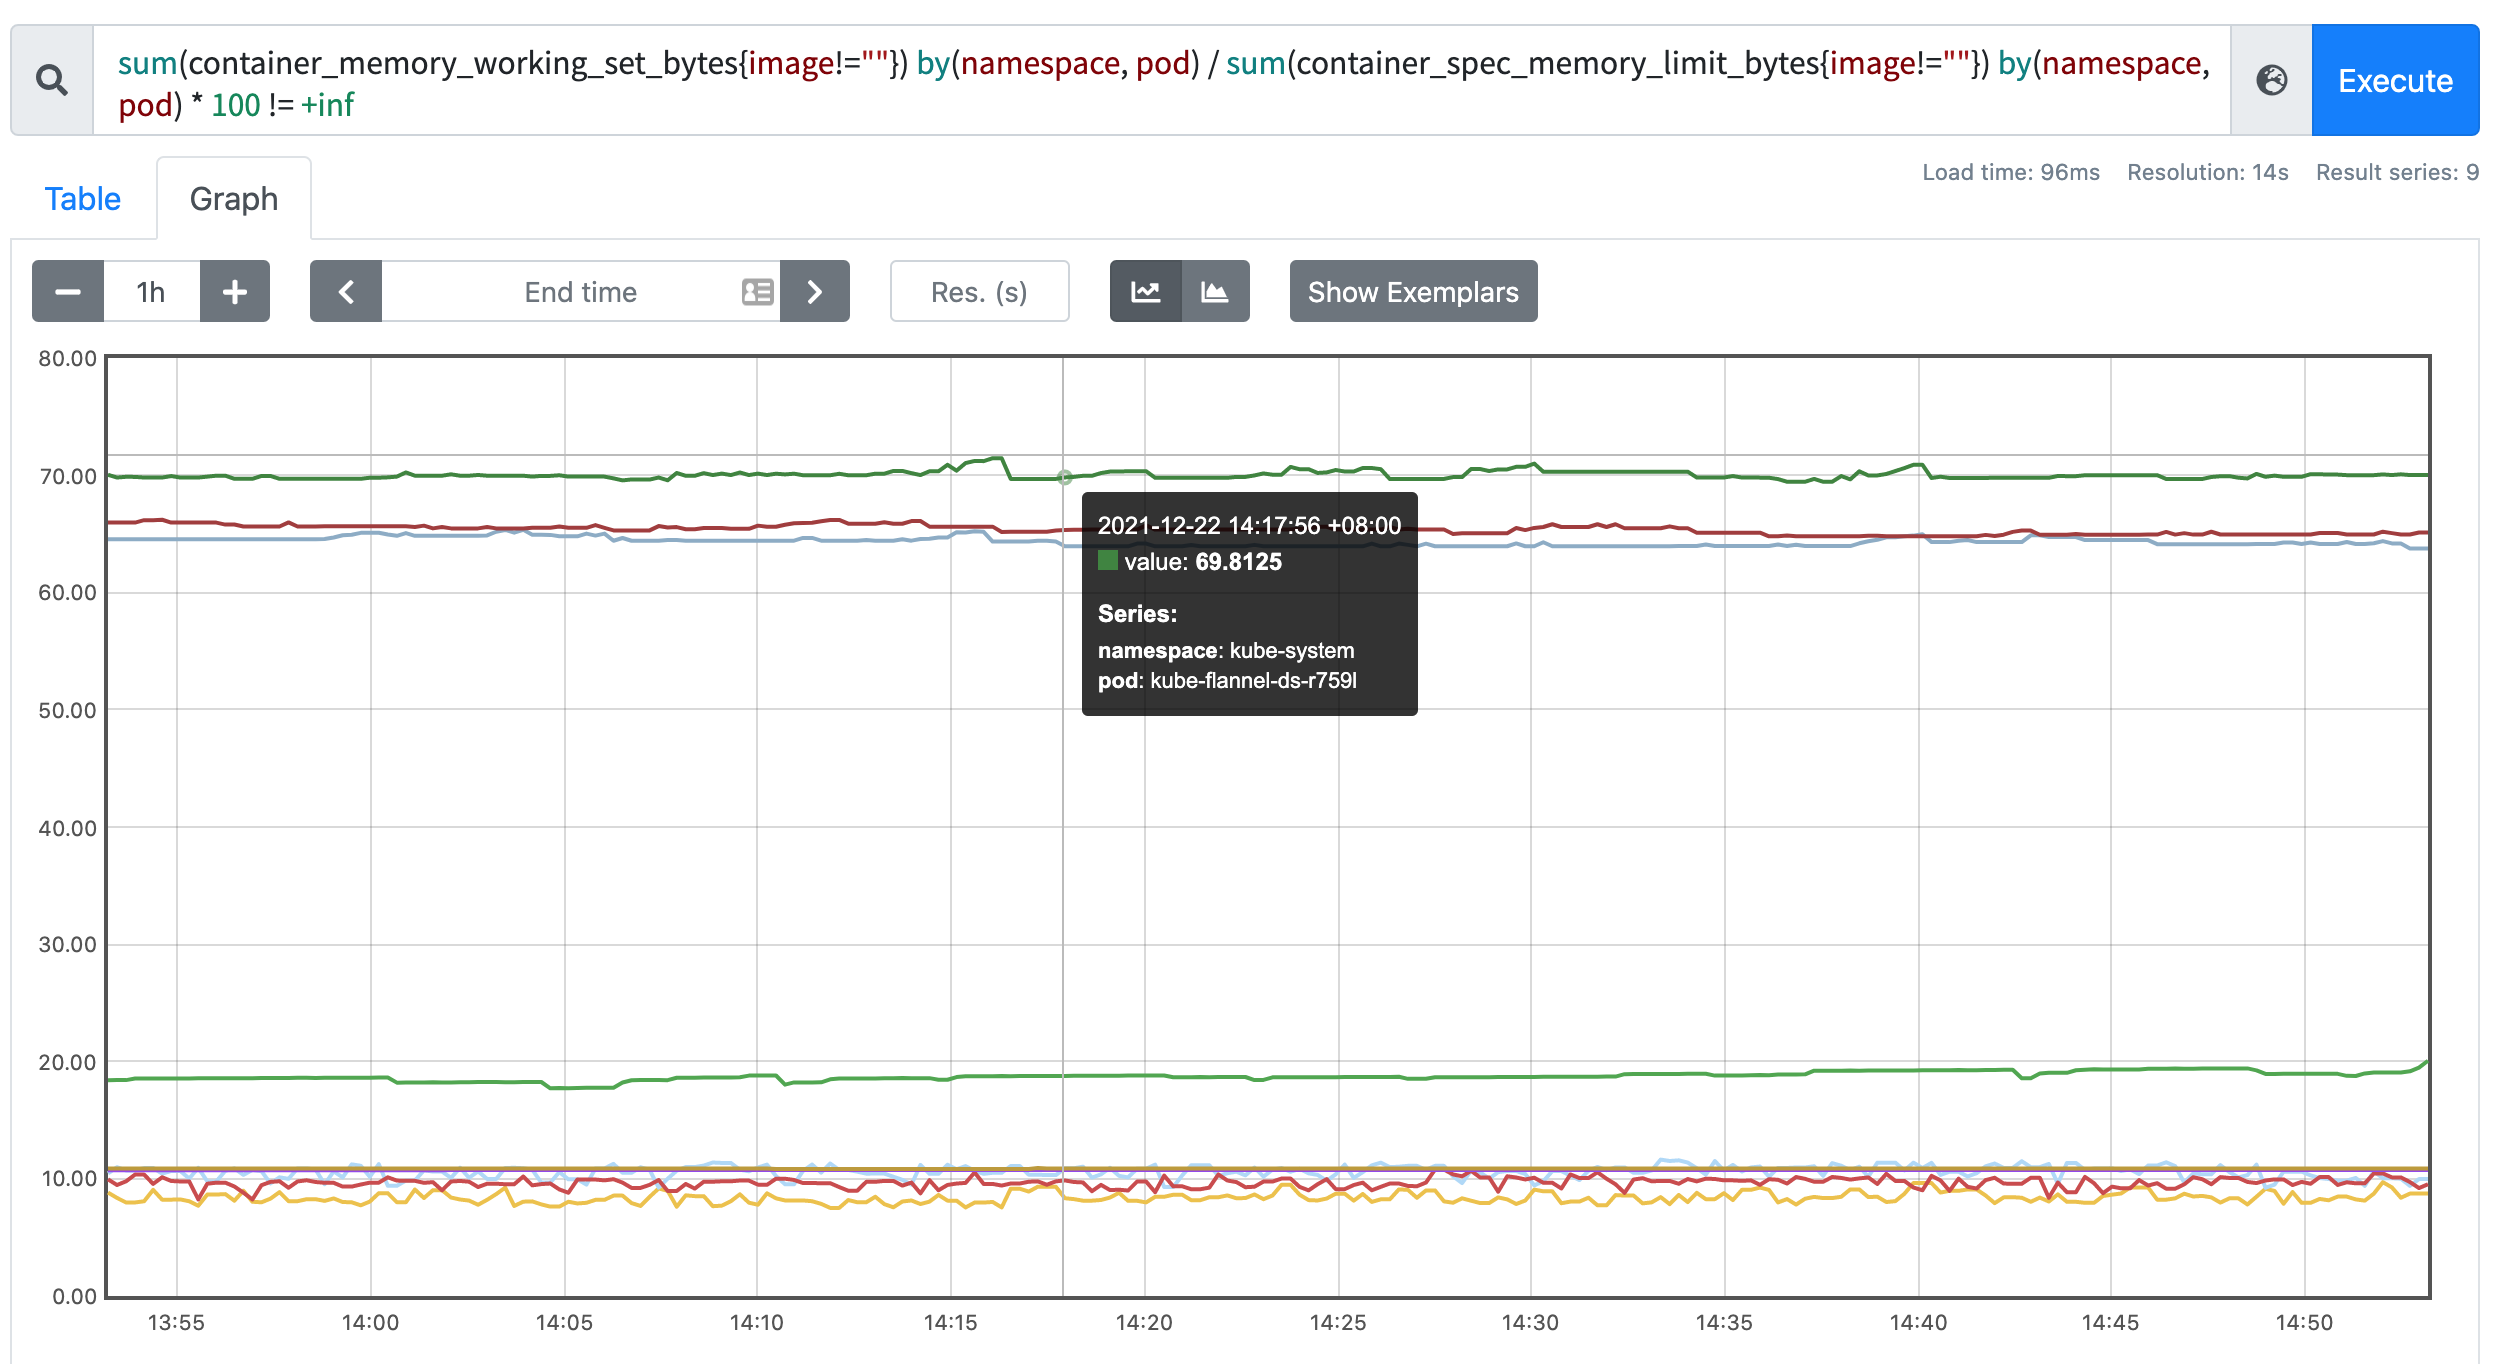
整体来说 container_memory_max_usage_bytes > container_memory_usage_bytes >= container_memory_working_set_bytes > container_memory_rss,从上面的指标描述来看似乎 container_memory_usage_bytes 指标可以更容易用来跟踪内存使用率,但是该指标还包括在内存压力下可能被驱逐的缓存(比如文件系统缓存),更好的指标是使用 container_memory_working_set_bytes,因为 kubelet 也是根据该指标来判断是否 OOM 的,所以用 working set 指标来评估内存使用率更加科学,对应的 PromQL 语句如下所示:
sum(container_memory_working_set_bytes{image!=""}) by(namespace, pod) / sum(container_spec_memory_limit_bytes{image!=""}) by(namespace, pod) * 100 != +inf
在 Promethues 里面执行上面的 promQL 语句可以得到下面的结果: